April marked the first “normal” month for Kaitlin in a while. March was crazy after a huge Facebook fan page shared her Etsy shop, February’s numbers were a bit skewed due to a lot of custom work for a friend’s wedding, and January we were on vacation for a big chunk of the month.
So it was nice to see things settle into place a bit during April. Let’s look at what that means for the numbers.
The quick stats:
Traffic: 13,706 unique visitors; -0.1% m/m
Gross Revenue: $5,189.08; -24.7%% m/m
Net Revenue: $3,947.70; -21.0% m/m
The Chart Porn:
April saw a big drop in revenue over March. But as I alluded to in the introduction, this was more a result of March being an outlier than April being particularly poor.
Miss Bizi Bee Traffic Breakdown
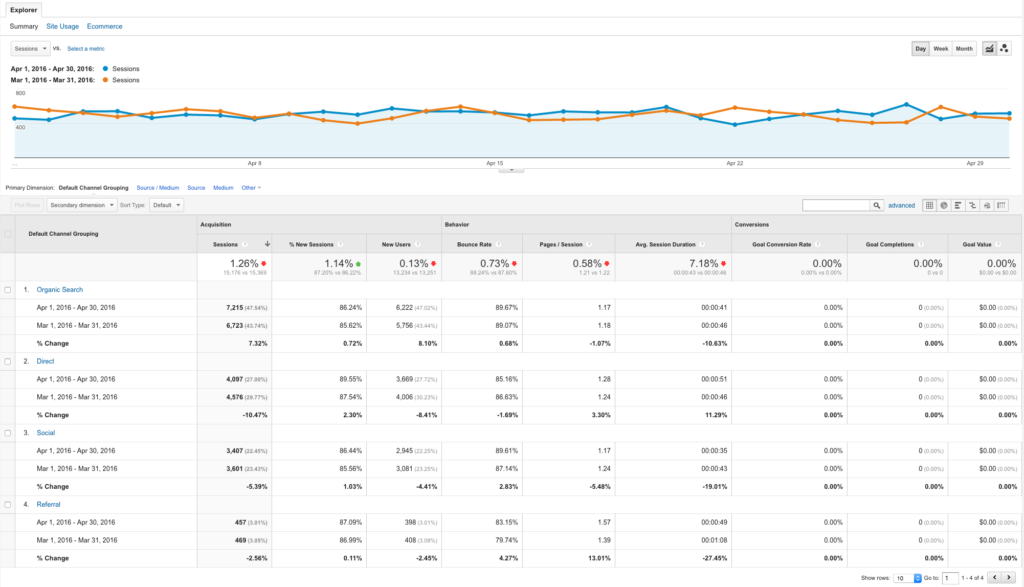
Traffic was basically unchanged on a month-over-month basis. Direct traffic took the biggest hit, falling about 10%. Social traffic was also down about 5%. But the bump in organic traffic cushioned these blows with a 7% increase.
Here’s a look at the different traffic channels compared to March:
While it’s a bit disappointing that traffic hasn’t been growing since the start of the year, there is a silver lining. Organic traffic is actually growing slowly. In fact, April marked a new all-time record for organic traffic:
So as long as organic traffic can continue increasing, even if it’s slowly, the blog will continue to grow and should produce increasingly more revenue.
Miss Bizi Bee Revenue Breakdown
As is usually the case, most of Kaitlin’s revenue came via her Etsy shop in April.
Of the $— in revenue here’s how it broke out by channel: Etsy (91.15%), Amazon affiliate links (7.82%), Amazon Ads (0.49%), AdSense (0.25%); Digital Revenue (0.29%):
Etsy Revenue
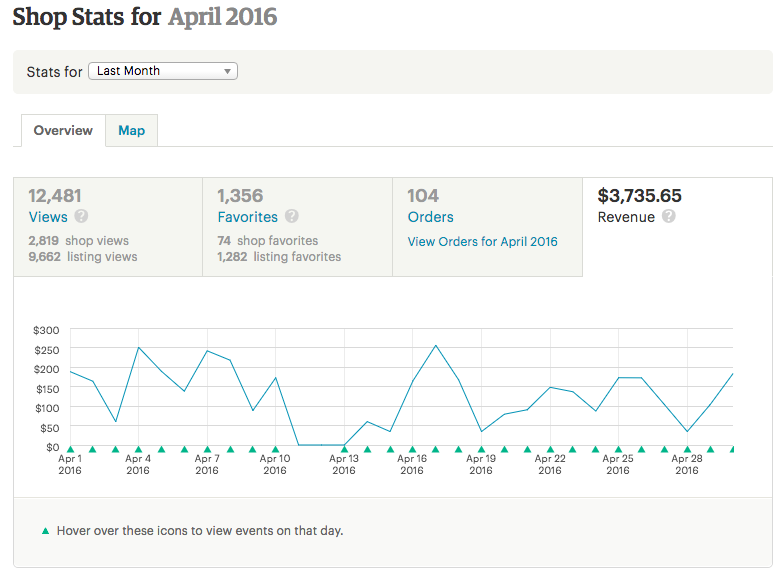
After March’s craziness, Etsy was a lot more consistent during April. Here’s a look at Kaitlin’s orders during the month:
Note that the revenue shown here does not include revenue generated via shipping. It was nice that things were business as usual and there were no surprises or huge, abrupt orders to deal with.
Blog Revenue
Revenue generated from just blogging came in at almost 9% of total revenue in April. This is actually the third largest percentage if you look back on all previous months. And if you exclude all the custom work Kaitlin did in February it would be the second largest.
Amazon Affiliate Links
Blog revenue was led by Amazon affiliate link earnings. This is marks the third time Kaitlin has managed to earn more than $400 in a month from this revenue channel. It’s also the first time she’s had back-to-back months breaking the $400 mark.
So while April wasn’t a record, I’m still quite happy to see the consistency here. Leveling up is almost always preceded by plateauing after a new high, and I think that’s exactly what’s happening here. I wouldn’t be surprised to see Kaitlin break through the $500 barrier some time in the next few months and settle in at a higher level again before pushing to newer highs.
If we look at the revenue generated per thousand unique blog visits, we see it’s still very consistent around the $30 mark:
Again, this simply means that as Kaitlin’s blog traffic increases we’d also expect her Amazon earnings to increase at about $30/1,000 visitors. That’s been a pretty good bet the last six months, and I don’t expect it to change.
AdSense
In March I threw some Adsense up on Miss Bizi Bee hoping to generate a little extra revenue for Kaitlin. A little is exactly what it generated.
That pattern continued in April with $12.95 coming in via Google Adsense. Hey, maybe Kaitlin will take me out for ice cream! 🙂
But in all seriousness, an extra $13 is an extra $13. At the end of the day, it’s nice to have some diversification in revenue streams even if they are such minor contributors. And just like with all blog generated revenue, this channel should grow as the blog traffic grows.
Amazon CPM Ads
April was the first month we had both Amazon CPM ads and Google Adsense running on the blog. I actually set this up on Kaitlin’s blog so that Amazon CPM ads and Adsense ads would be evenly rotated. I wanted to see which performed better.
It’s now pretty clear that Amazon ads perform better than Adsense. Amazon CPM ads produced $25.53 in revenue compared to Adsense’s $12.95 — granted, $6.00 of Amazon CPM ad revenue was attributed to “bounties”. But even if you take that out (which I’m not sure would be justified), Amazon ads still outperformed.
So I need to get into the guts of Kaitlin’s WordPress and move things around a bit. It won’t move the needle for her a ton, but hey… every little bit counts!
Miss Bizi Bee Expenses Breakdown
As has been the case for awhile now, Kaitlin’s expenses were pretty predictable. This month her expenses represented 23.92% of her revenue, the lowest since December:
As easy as it would be to brush over this, it’s actually pretty interesting. December’s expenses were much lower than usual because Kaitlin had stocked up on some commonly used materials that she needs to fulfill Etsy orders.
So really, this is the lowest her true revenue-to-expenses ratio has ever been. The reason for this is because nearly 9% of Kaitlin’s revenue was generated by the blog and not Etsy.
Now, the astute reader would say, “Yeah, but Kaitlin’s Etsy revenue has accounted for less than 90% of total revenue before”. And that’s true, however, it’s not that simple.
There were only two months that Etsy revenue was less than 90% of the total: January and February of 2016.
In January, Kaitlin’s Etsy shop was closed for nearly two weeks. Well, even when Kaitlin’s Etsy shop is closed her blog is open… meaning she’s still generating revenue from the blog while on vacation. So it makes sense that blog revenue would make up a larger piece of the pie. Afterall, the blog stayed open while Etsy was closed. So the pie was smaller overall, but the blog piece stayed about the same.
February was also abnormal. If we go back and look at the data, 9.62% of Kaitlin’s February revenue came via direct orders. All that means is they’re basically Etsy orders done off the platform for friends or family. If we clumped that in with Etsy revenue, the total would come to nearly 93.50% of her revenue for the month.
So the thing that makes April so special is that it wasn’t special at all. Kaitlin did $0 in direct orders, which is pretty common. There were no surprises on Etsy with crazy social media traffic that accounted for a ton of revenue. We didn’t go on vacation; Kaitlin’s shop was open all month.
And this is why her costs as a percentage of revenue dropped. Blog revenue has grown to the point that during a “normal” month of Etsy earnings, it’s now significant enough to dilute total expenses. Said another way, since there’s so little cost associated with blog revenue, it’s now starting to pull down the total cost of all revenue, including Etsy.
So as long as the blog revenue continues to grow, we should see the ratio continue to decline and eventually plateau out at a lower percentage.
OK, sorry for the long explanation, but I couldn’t help myself 🙂
Looking Toward May
With a 4-month old puppy and a baby just a few months away, you’d expect Kaitlin to be slowing down a bit. If that’s what you think, you don’t know Kaitlin.
She hasn’t slowed down much at all, and I’m expecting May will be a pretty normal month. We both know that once Bizi-Baby comes she’ll be taking some time away from Etsy, so she’s making the most of the time she has now. Make hay while the sun shines, right?


Congratulations ! I am really inspired seeing your blogging income.